Unfetter Analytic
Measure the effectiveness of your analytics.
WELCOME
Unfetter Analytic is a reference implementation, inspired by The MITRE Corporation CAR and ATT&CK™ framework, and supported by The MITRE Corporation and the National Security Agency (NSA). Unfetter Analytic is a prototype that allows developers to gain familiarity with the ATT&CK™ framework to measure the effectiveness of their analytics. Write analytics and map them to the MITRE ATT&CK™ techniques you want to detect. When the analytic event is created, the Kibana display shows the context around the event.
ATT&CK™ stands for Adversarial Tactics, Techniques and Common Knowledge. It is a model and framework that describes the actions an adversary may take while attacking an enterprise network. ATT&CK™ specifically focuses on post-exploitation of Windows host systems. Think of it as a roadmap that lays out what an attacker COULD be doing on your network.
MITRE's Cyber Analytic Repository, or CAR, is an effort to document and share analytic ideas and lessons learned. Each CAR analytic is framed by the ATT&CK™ behavior(s) it is trying to identify.
Unfetter Analytic, a reference implementation that provides a framework for collecting events from a client machine (Windows 7), supports building and testing analytics in the CAR model, and displays the alerts as they reference the ATT&CK™ framework. Unfetter Analytic is not designed to be a production intrusion detection system, but it is an educational capability for analytic developers to try, explore, and learn the concepts discussed at http://mitre.github.io/unfetter.
Architecture
This reference implementation provides a framework for collecting events from a client machine (Windows 7), and performing Cyber Analytics Repository (CAR) analytics to detect potential adversary activity.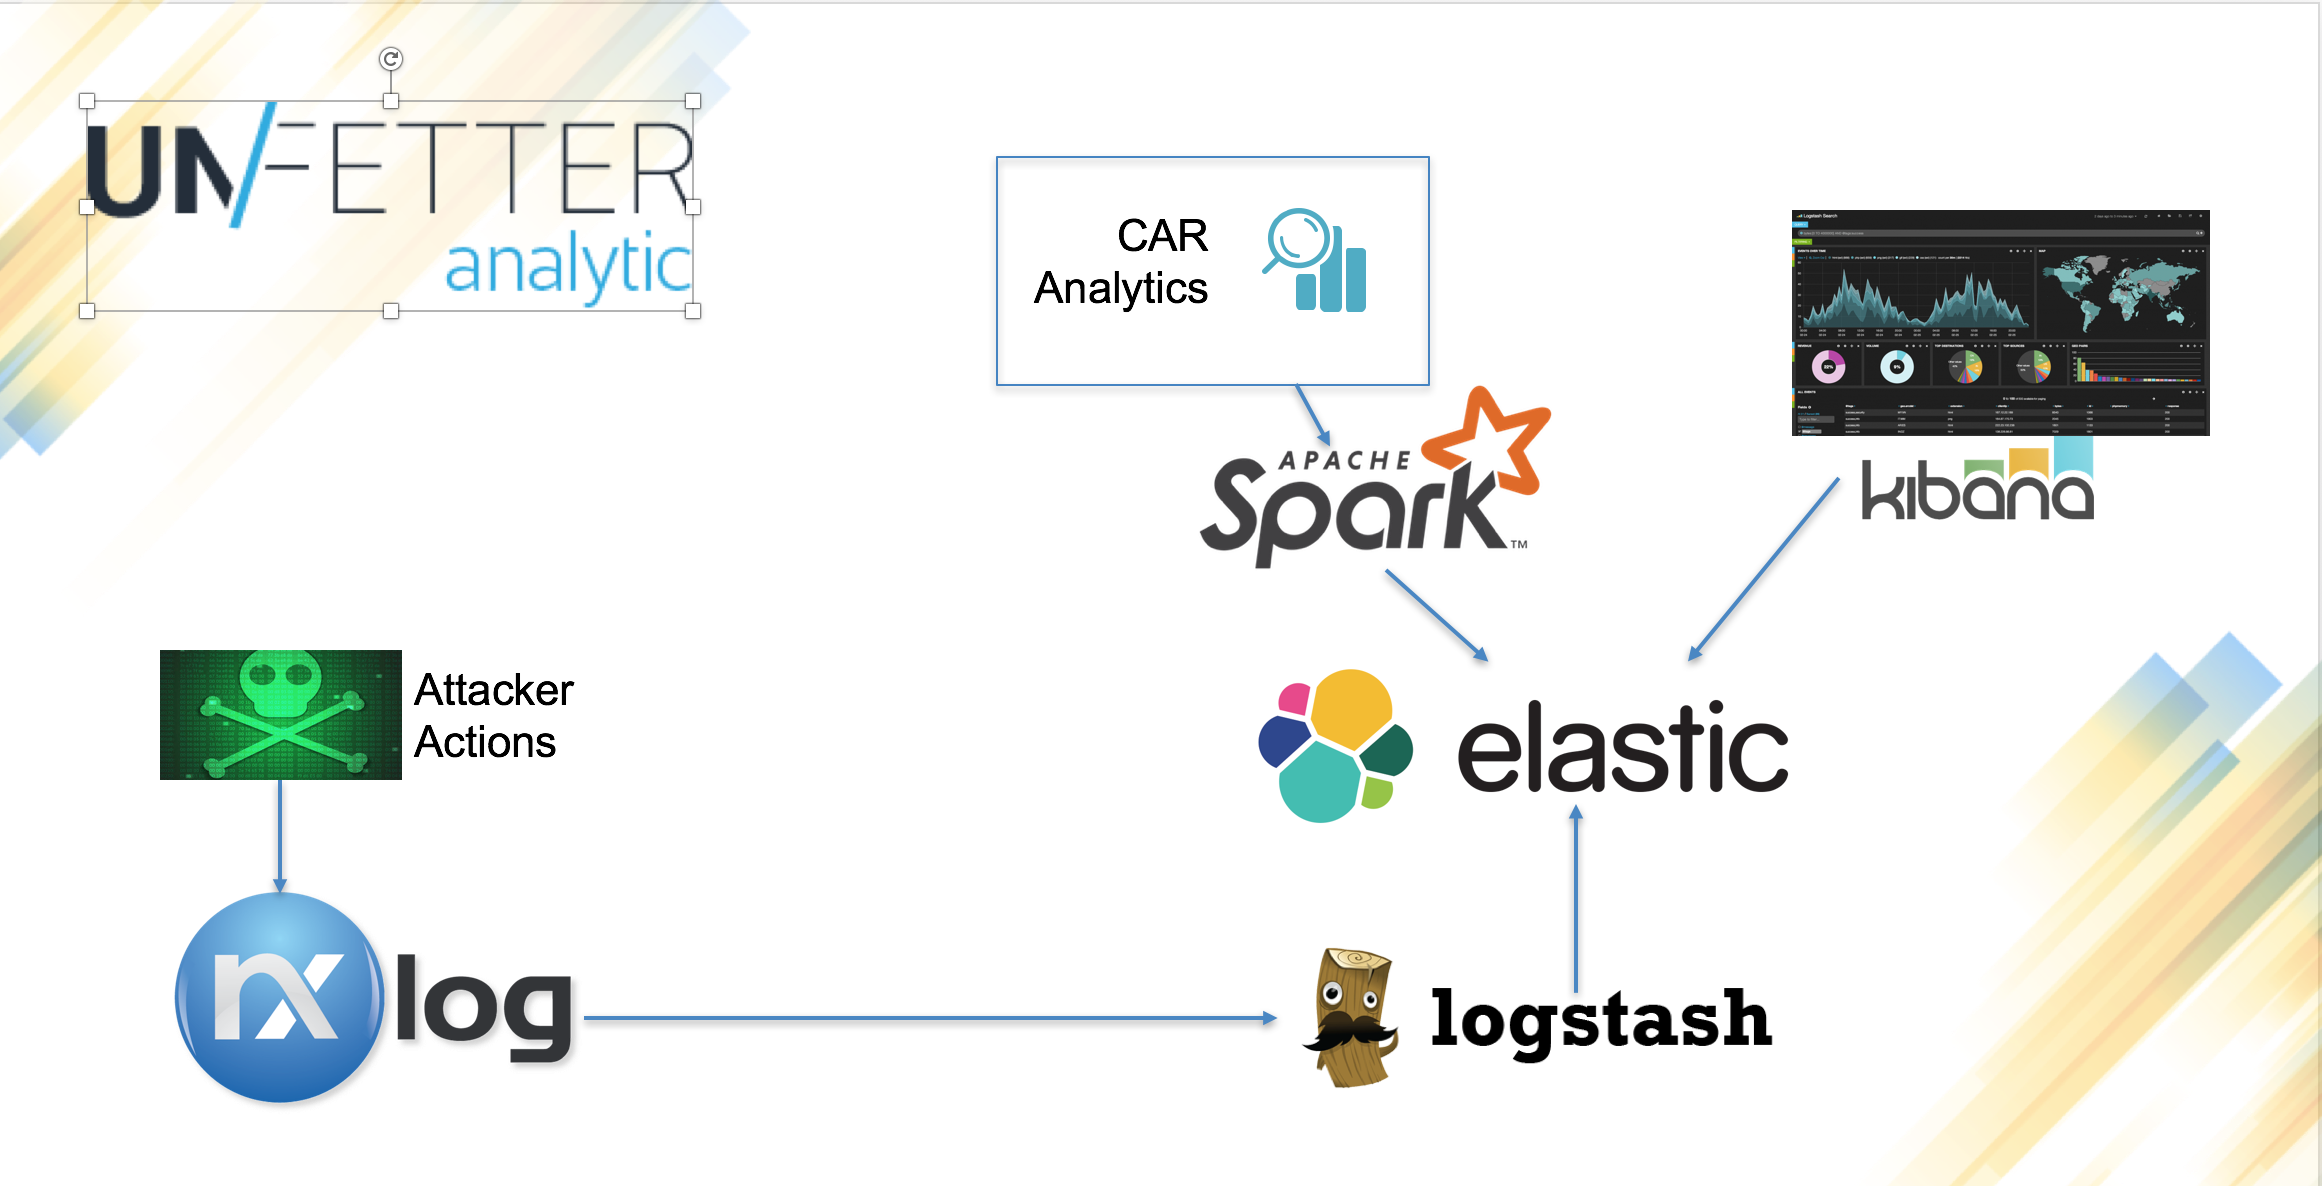
On the left-hand side of the diagram, you see the Windows System, or the "victim machine." NXLog ships standard Windows events to the Unfetter Analytic system. The Windows system, once built, runs Microsoft Sysmon.
On the right, the Unfetter Analytic server is running an Elasticsearch, Logstash, Kibana software stack and Apache Spark as the main analytic system. Event logs from the victim system and generated alerts are stored in Elasticsearch and are viewable through Kibana.
Designed For Experimentation
This is not designed for production use. Architectural decisions were made to make it easier to collect and analyze data, as opposed to the more robust requirements needed in a production system. The system was designed to make personalized data source additions easier for experimentation purposes. Take it, use it, learn, and let us know what you think through our GitHub Issues Tracker.
The Unfetter Analytic server-side system is built using Docker to easily spin up containers for running each of the desired applications.
These instructions show how to setup the Windows Victim and the Unfetter Analytic SIEM. Services will be configured and started, Windows event logs and Sysmon data will be forwarded and ingested, and Kibana dashboards will be running, analytics will run and alerts can be pushed to Unfetter-Discover in future releases.
The Unfetter Analytic system was tested on Windows 7 Professional and Windows 10 Home host operating systems (OSes) using VirtualBox. However, any OS that supports Vagrant should work, since both systems run in virtual machines (VMs).
To install the prerequisites
- Install Docker
- Install Vagrant (optionals)
- Install Oracle's VirtualBox
- Install a git client
Starting The Server
The Unfetter Analytic Linux VM contains the ELK stack, Apache Spark, and the Python (PySpark) files that run the analytics.
The Windows VM is a Windows 7 32-bit with Microsoft Sysmon and Nxlog installed.
There are two GitHub projects needed to run the Unfetter Analytic system. They are all found under www.github.com/unfetter-analytic
You can easily clone the GitHub repos and start the Unfetter Analytic SIEM:
mkdir unfetter-analytic
cd unfetter-analytic
git clone https://github.com/unfetter-analytic/unfetter.git
git clone https://github.com/unfetter-analytic/windows-example.git
cd unfetter
docker-compose up
In analytic-system directory, there is a file called run.sh. Docker will run this file as the main workhorse for the analytic system. It is looping through all the analytics and running them, pushing any results to Elasticsearch AND the locally created Unfetter-Discover. Change run.sh to perform whatever analytics you want.
Wait until Docker has started. There won't be any data until the Windows system begins running and forwards events.
The running docker container "analytic-system" has the analytics. If you want to run analytics individually, attach to this container to run them.
Starting Windows Victim
Setting up the Windows system the first time has a few more steps than setting up the analytic server. You will need a version of Windows 7 that can be created as a box file. There are a few ways to do this, but these instructions will show you how to use modern.ie to download an evaluation copy of Windows 7 from Microsoft.
- On your Windows machine, install WinLogBeat 6.x. You may use our sample winlogbeat.yml file.
- On your Windows machine, install Sysmon 7.x. You may use our a sample sysmon.xml file.
We have included Vagrant files to help install and manage the VMs. Vagrant won't be able to complete the provisioning on its own. Manual configuration of Vagrant is necessary so that Vagrant can communicate with the guest Windows OS. When the Windows GUI starts, do the following on the VirtualBox window. HOWEVER: the Vagrant file does not properly setup all the services as described above. This is a bug that needs to be fixed.
Set the network location to Home or Work. Go to Control panel -> Network and Sharing Center and click on "Public network" under "View Your Active Networks" in order to change the type. Run the following script as administrator:
@echo off
set WINRM_EXEC=call %SYSTEMROOT%\System32\winrm %WINRM_EXEC%
quickconfig -q
%WINRM_EXEC% set
winrm/config/winrs @{MaxMemoryPerShellMB="300"}
%WINRM_EXEC% set winrm/config @{MaxTimeoutms="1800000"}
%WINRM_EXEC%
set winrm/config/client/auth @{Basic="true"}
%WINRM_EXEC% set winrm/config/service @{AllowUnencrypted="true"}
%WINRM_EXEC% set winrm/config/service/auth @{Basic="true"}
Navigate back to the window where "vagrant up" was executed. Provisioning should continue now that Vagrant can communicate with the guest OS. Vagrant will install and configure Sysmon and Nxlog. When it is all done, check the following log file for errors to make sure the Windows machine can see the analytic server: c:\Program Files\nxlog\data\nxlog.log
The VM can be accessed through the GUI. If you used Modern.ie, then the credentials are "IEUser/Passw0rd!"
It is HIGHLY recommended that if you work with Microsoft Windows, you purchase a licensed copy and build your own Vagrant box file. If you want to make your own base Windows box, this webpage has an example.
Web Interfaces
Unfetter Analytic provides three interfaces to see your collected data. Kibana provides a full-featured interface to perform complex searches. You can access it at: http://localhost:5601
Unfetter Analytic uses a Windows VM to generate interesting events such as process creation, user logins, and network connections. The events are shipped to the Unfetter Analytic server, Logstash is used to ingest them into Elasticsearch, and then Apache Spark is used to run an analytic that generates new events (generally either alerts or items for situational awareness).
Below is an example process to generate an event that will trigger an alert in the Windows VM.
Interact with the Windows VM Graphical User Interface (GUI) and start Powershell as administrator. Run the Powershell command to clear the security event logs: PS C:\Windows\System32> Clear-EventLog -Logname Security
To see the events in Elasticsearch you can use either Kibana or the lighter weight Elasticsearch-head plugin. From the browser in your host OS, go to Kibana: https://localhost:5601 Another option is to use the Elasticsearch-head plugin. Click on the "Browser" tab on the following page:
Create new analytics by putting them in the unfetter-analytic/unfetter-analytic/analytic-system/src directory. A quick
lsRestarting the containers will pull the new run.sh file and start running them.
The es_helper.py helps set up and interact with Elasticsearch.
The main program is run_unfetter_analytic.py. This Python program will call the CAR analytic Python code you specify. Here is a simple example:
spark-submit run_unfetter_analytic.py -c CAR_2016_04_002.py -d day 1 -p
This command will use spark-submit to run the "run_unfetter_analytic.py" program, which will load and execute CAR analytic CAR_2016_04_002 and will look through the last 24 hours of events. It will push any alerts to Elasticsearch and also Unfetter-Discover.
After printing the Unfetter banner, run_unfetter_analytic will display the CAR name, number, and description. This will generate a number of alerts once it completes.
The alert should now appear in Kibana. Adjusting the time interval in the upper right-hand corner may be necessary.
Getting Involved
Are you interested in getting involved? We welcome any and all comments, suggestions, or bug reports through our GitHub Issue tracker. Checkout our GitHub Page for installations.