Event Log Tool User Guide (Linux)
The Event Log Tool rpm install will create a command line shortcut. This can be invoked from a command line by using:
elt –h
Invoking this command will bring up a help page, which lists out the Event Log Tool’s many uses and functions.
Parameters
-f: --file
- Use a specific Event Log file. The following parameter MUST be a path and file name.
- If this option is not present, the tool will look for the Event Log file in the default location.
- Note: Access to the log at the default location may require admin privileges.
-e: --event
- Display event descriptions (including event content) in human-readable form.
- The following optional parameter is a single event number used to filter the output.
- All events will be displayed if the optional parameter is not provided.
-ec: --contenthex
- Displays event content in eventhex format when -event is used.
-ex: --eventhex
- Displays event in hex format when -event is used.
-d: --diff
- Compares two TPM Event Logs and outputs a list of events of the second log that differed.
-o: --output
- Output to a file. The following parameter MUST be a relative path and file name.
-p: --pcr
- Output expected PCR value calculated from the TPM Event Log (for PCR Replay).
- The following parameter MAY be a PCR number used to specify a single PCR.
- If there are no following parameters, it will display all PCRs.
-v: --version
- Parser version.
-x: --hex
- Displays an event in hex format. Use with -ec to get content.
- Use -e -ec and -ex options to filter output.
- If this option is not present, all output will be human-readable form.
Event Log Structure
Info
The TPM Event Log default location is shown here.
The format of the Event Log file is as follows (see Example Output for an example):
-
pcrIndex: The PCR Register number, typically shown in documentation as PCR[0], where 0 is the pcrIndex.
-
eventType: An enumerated type found in Table 27 of the PFP (Version 1.06 Revision 52). The PFP uses upper case labels to reference the events (e.g. event type 0x00000007 is labeled EV_S_CRTM_CONTENTS).
-
digests: This is a hash value (SHA1, SHA256 or SHA384 depending upon the log type). This may be a hash of firmware, a file, or the event itself. The coverage of the digest is dictated by Table 27 of the PFP.
-
eventSize: The size (in bytes) of the event data.
-
event: The event data as described by Table 27 of PFP.
Note
In HIRS, the Event# is not part of the TPM Event Log, but it is displayed because it is useful for identification purposes.
Displaying Events
Displaying All Events
In order to display all events within a specified log file, you will need an Event Log file. Typically the filetype would be a .bin. See Example Output for an example.
Once you have this file, you can input the filename into this command for results:
elt -f binary_bios_measurements.bin -e
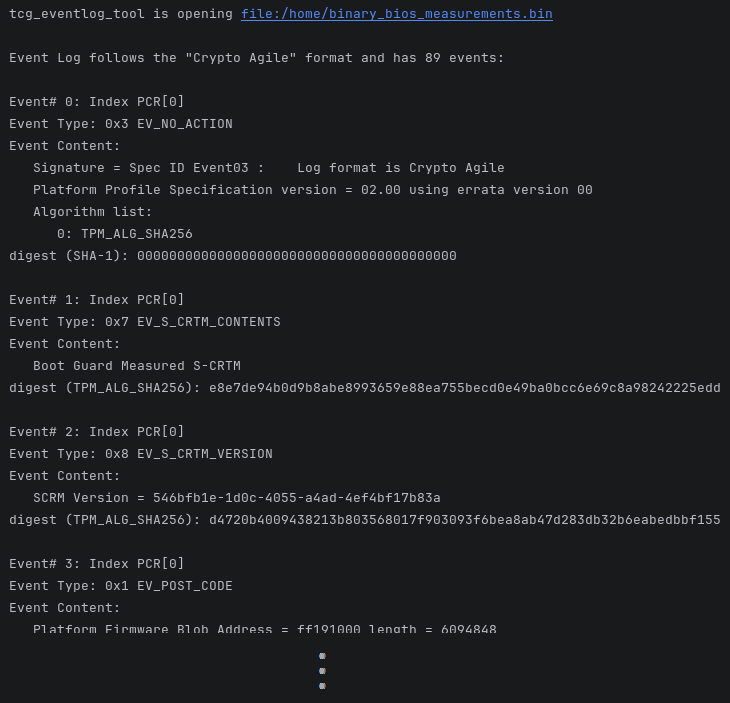
The tool will list every event. In this example, there are 89 events in all.
Displaying Only One Event
If you would like to display only one event from an Event Log, you can use:
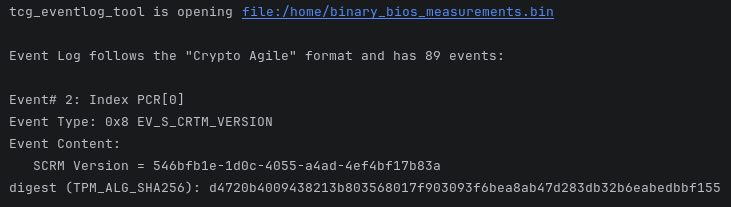
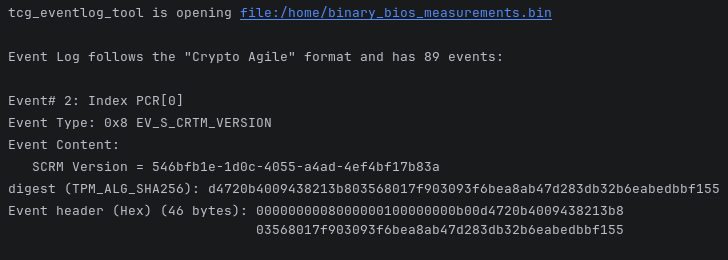
elt -f binary_bios_measurements.bin -e 2
For this example, Event #2 was used.
Outputting Event Log Information to a File
If you would like to output information from the tcg_eventlog_tool to an external file for use later, you can use the -o option as below:
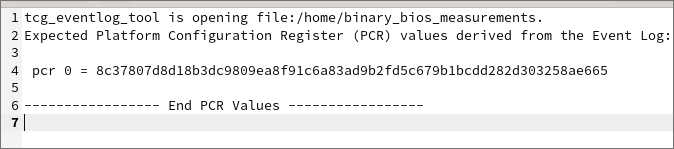
elt -f binary_bios_measurements.bin -p 0 -o example.txt
In this case, the query information about the binary_bios_measurements.bin file was saved to a new text file named example.txt, which now contains:
Displaying Information in Hex Format
Displaying An Event in Hex Format
If you would like to display an event from the tcg_eventlog_tool in a hex format, you can use the –x option like this:
elt -f binary_bios_measurements.bin -e 2 –x
In this example, Event #2 is transcribed into hex format:

Displaying An Event in Hex Format With Additional Context
If you would like to display an event in hex format with additional context but no content information, you can use the -ex option like this:
elt -f binary_bios_measurements.bin -e 2 -ex
In this example, Event #2 is transcribed into hex format:
Displaying Event Content in Hex Format With Additional Context
If you would like to display an event with content information in hex format with additional context, you can use the -ec option like this:
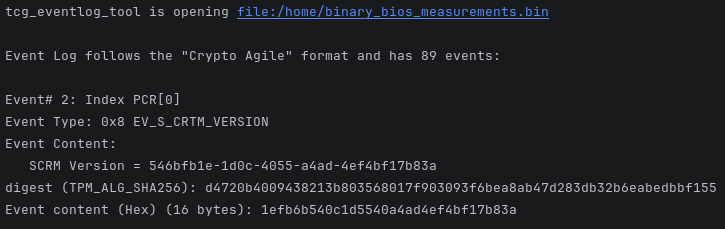
elt -f binary_bios_measurements.bin -e 2 -ec
In this example, Event #2 and its content have been transcribed into hex format:
Displaying Expected PCR Values
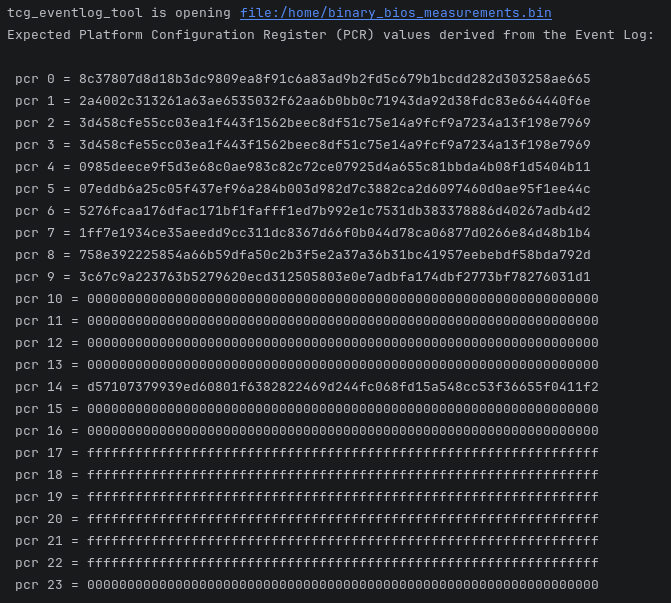
If you would like to view all expected PCR Values of an Event Log, you can use the -p option as below:
elt -f binary_bios_measurements.bin -p
Comparing Event Log Files
If you would like to compare Event Log files to see where certain events may have failed comparison, you can use this command:
elt -d binary_bios_measurements.bin binary_bios_measurements_altered.bin -p
The two files being compared in this example are binary_bios_measurements.bin and binary_bios_measurements_altered.bin.
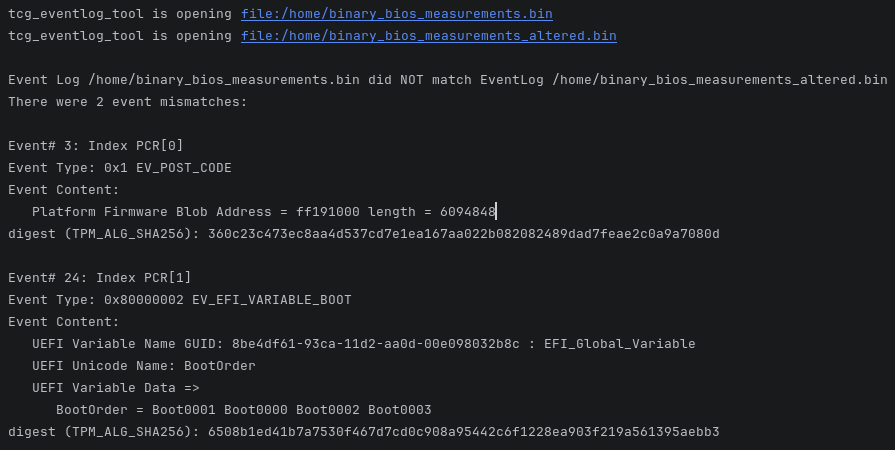
As you can see above, the Event Logs had 2 event mismatches. Since a mismatch has occurred, this could mean that the digest values within the Event Log are not verifiable and may have been tampered with.